
Corona and the media: Evaluation of media coverage of the pandemic in Germany
What importance was attached to the Corona pandemic in the German press? Do the infection figures correlate with the reporting? And what was the coverage like in the summer of 2021, when new infections were at a very low level?
Methodology
From January 2021 to the end of February 2022, roughly from the peak of the first winter wave to the second winter wave of the pandemic in Germany, we registered a total of around 450,000 articles on six news sites we analysed. The six sites analysed are Tagesschau.de as a public service publisher with national significance and BR24, a successful regional news service of the public broadcaster. t-online.de is there as a representative of the boulevard. In addition, there are Spiegel.de, Zeit.de and FAZ.de, which were selected because of their social-liberal and conservative reputation respectively and have national relevance. In the teaser texts and headlines of the registered articles, we then filtered for keywords such as Covid-19, Corona, Coronavirus or even Sars-Cov-2. This forms the data basis for this report.
Corona's share of reporting
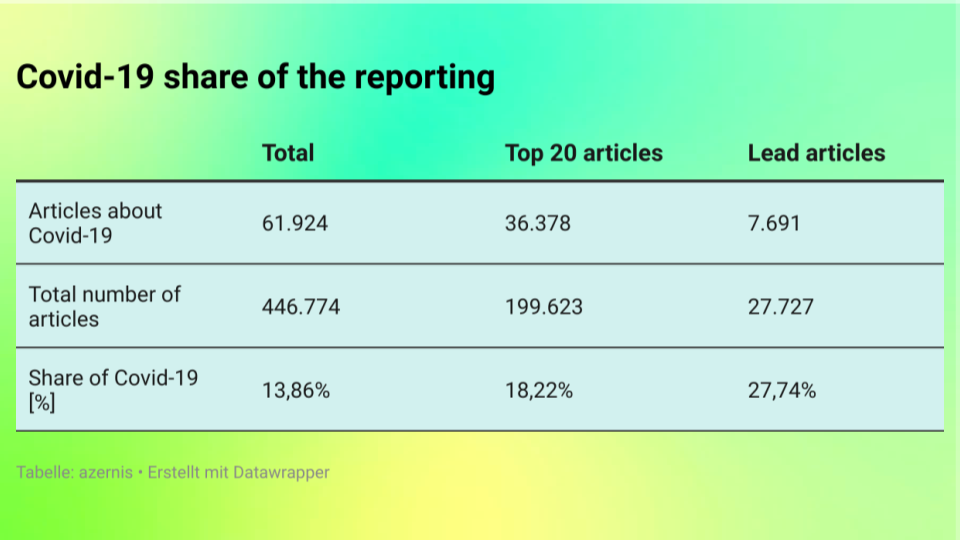
A total of 61,924 articles with reference to the coronavirus, or about 14%, were identified in this way. However, since some of the publishers examined also automatically publish content from news agencies on their home pages, which readers rarely see (since they are unlikely to scroll down that far), it is more interesting to look at the top 20 articles. It is striking that in the top 20 articles, the proportion relating to the pandemic was even higher. If we look only at the articles that also appear in the first 20 positions on the homepage, then 18.22 % of the articles reference the Coronavirus. It should be noted, however, that not every article that mentioned one of the keywords necessarily discussed the pandemic as its main topic. There are also teaser texts that talk about 'the good business figures in the Corona year', for example.

This content is hosted at Datawrapper. If you load this content, data may be shared with Datawrapper.
An examination of the lead story, i.e. the top position on a news page, is even more relevant, as this is where the editors place the -in their opinion- most important topics and reach the most readers. We registered 27,727 articles there during the period under review. 27.74% of them had a reference to the Corona pandemic. The topic is therefore not only very present in everyday life, but is also a constant topic in the media. More than a quarter of all headlines were about the pandemic!
On the correlation between reporting and infection figures
But how does the coverage relate to the number of infected people? Do the Corona waves correlate with possible waves of reporting? And how present was the topic in the reporting in the summer of 2021, when there were hardly any infected people?

This content is hosted at Datawrapper. If you load this content, data may be shared with Datawrapper.
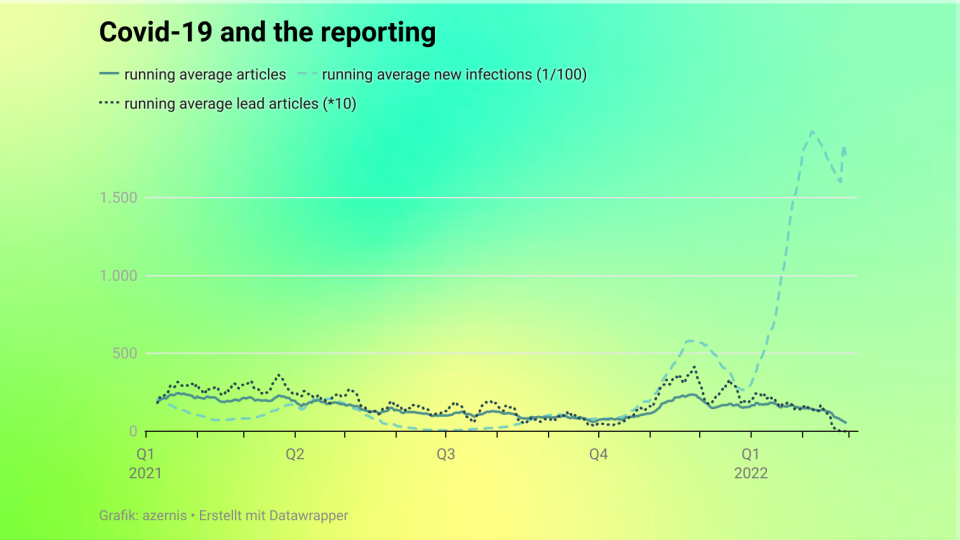
To make this graph more descriptive, the values have been smoothed. This means that a running average was taken for the number of new infections, the number of articles and the number of lead stories. This makes the curves somewhat 'smoother' and balances out the daily fluctuations. This is because fewer articles are published at weekends and the number of new infections is also known to be lower. In addition, the number of new infections was divided by the value 100 and the number of lead stories was increased by a factor of 10. On the one hand, this leads to the graph starting at approximately the same value for all curves, and on the other hand, it allows all curves to be included in a diagram at all. Because with values of tens of thousands of new infections, the few hundred articles about them would not be readable in the graph.
At the same time, this also means that at the beginning of 2021, there was one article for every 100 newly infected people in Germany published by the publishers studied. This ratio changes dramatically in the summer of 2021. The highest mismatch between newly infected persons and reporting occurs in the first week of July, when there was one article for every 6 new infections among the publishers studied. As the number of infections increased, the ratio of 100 was reached again by the end of August 2021. Towards the end of the year and especially in January and February 2022, the number series increasingly decouple again. In the last week of February, the ratio is 1:3202. So there are extremely many infected people, but the reporting on this is not equally pronounced.
Correlation coefficients
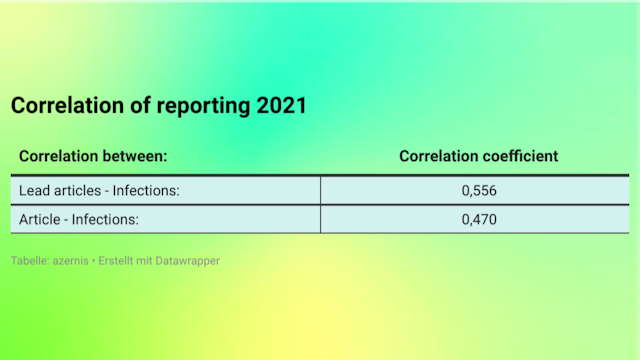
Initially, however, this is less due to the reporting than to the exploding number of infected people. Because with the increase in the number of infections, the reporting also increases again in autumn and winter. In particular, the number of lead stories also increases very strongly. The curves are almost identical at the time in November. Overall, it can be seen that the number of lead stories correlates somewhat better with the new infections than the sheer number of articles. For the full year 2021, a correlation coefficient of 0.556 is found between the number of lead stories and the infection figures. This value means that the two sets of numbers are slightly positively correlated. The correlation between the number of articles and the infected is slightly less strong and amounts to 0.470.

This content is hosted at Datawrapper. If you load this content, data may be shared with Datawrapper.
Remarkable data points
What is striking about the year is the high number of new articles and openers at the end of November. On 26 November, a new peak in new infections was reported by the Robert Koch Institute (RKI). At the same time, the first support flights of the German Bundeswehr started in order to transfer Bavarian Corona patients to other federal states. In addition, the World Health Organisation (WHO) classifies the new variant (later called Omicron) as 'of concern'. This high number of relevant events has led to this large number of articles and lead stories. Another date with many openers was 23 March. On this day, the new lockdown over the Easter holidays was decided, which subsequently caused controversy as this Easter lockdown was later reversed.
In January 2022, there are steadily fewer lead stories concerning the Covid Pandemic and the number of articles also drops slightly. By the end of February 2022, there are even no more Corona-related lead stories and the number of articles also drops sharply. Russia's invasion of Ukraine on 24 February 2022 displaced the Corona coverage (for the time being?).
Summary
The figures clearly show a correlation between the number of new infections and the coverage of them. The waves of the pandemic are equally matched by waves of coverage. However, this correlation is not fixed, so that the correlation has become increasingly decoupled in the winter wave. That is logical, after all, the numbers have literally exploded. The reporting cannot keep up with that.
The increasing decoupling at the beginning of 2022 also shows a certain pandemic fatigue. Although the number of cases is high, the readers' willingness to pay even more attention to the pandemic is presumably rather low. The correlation between reporting and new infections is increasingly disappearing. In addition, the war in Europe is increasingly pushing the pandemic into the background.
About this article
Written by Stefan Paulus
Published at: 4/13/2022, 7:00:00 AM
About azernis
azernis is a data-driven software solution to monitor competitors in the news industry. Identify quickly all relevant topics of your competitors and start with us into the data age. More information on our homepage.